Did The Market Just Turn?!
HELLO EVERYBODY! Yes, you DID just read that title correct. Today we are asking the question if the Vancouver Real Estate market really did just take a turn upwards?!
The thing with a falling market is, you have a lot of buyers who want to time the market and wait for the ‘bottom’ if you will. Essentially this means the level in which prices stop dropping further, as they have now reached their lowest point.
Well the latest statistics released for Metro Vancouver by the Real Estate Board show we are now at the infamous ‘bottom’.
July, which is usually one of the slowest months in Vancouver Real Estate, was the second busiest month this year and saw home buyer demand pick up. Across Metro Vancouver as a whole, there were 2,557 home sales in July 2019. This is a 23.5% increase from July 2018 and a 23.1% increase from June 2019. On top of this, the amount of homes listed across Metro Vancouver dropped by 4.9% since June 2019. Meaning buyer demand went up and inventory available went down.
To throw some more sexy numbers your way, check out the sales-to-active listing ratios below (this is basically a ratio determining how many homes have sold vs how many are available on the market):
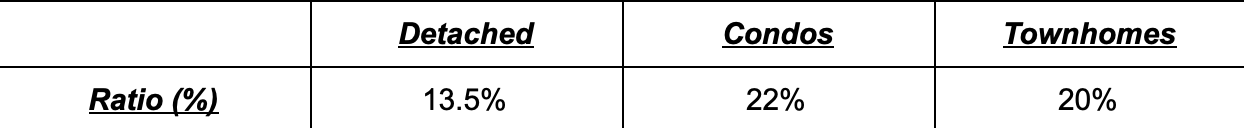
Now what makes these numbers REALLY sexy is what they mean when it comes to market analysis. Generally when the ratio is below 12% for a sustained period of time, it puts pressure on prices to drop. However, when this percentage sits at 20% or more for a sustained period of time, it encourages pricing to rise! Note the Condos and Townhomes are sitting at 20% or above. With detached homes sitting at over 12% this suggests pricing at this level will remain at similar levels.
Now the above information is for Metro Vancouver. When we take a look at the smaller geographical area that is Vancouver Eastside and Westside (Including Downtown) we get the following ratios:
Of course, in order to make a difference in pricing, these figures need to remain higher for a sustained period of time, so don’t expect immediate price hikes. If the market continues in this direction though, this will inevitably have a knock on effect with regards to pricing. There is always some lee-way that needs to be given with these numbers as they can be skewed slightly, which is why the ‘sustained period of time’ is so important.
As this is really only the start of these market signs, this is enough to suggest we are at the bottom and anyone looking to hold out until this time, NOW IS YOUR TIME. Or you run the risk of missing the opportunity. A lot of people will still say we are at record lows, and however true that maybe, the market will always turn at some point and this looks to be it.
Interesting times to come in the Vancouver Real Estate market, especially as we have heard a lot of doom and gloom talk about a possible recession, various expectations and what not. Next month will be very interesting to see if the trajectory continues upwards on what would typically be one of the slower months in the market, before we start hitting the Fall (typical) rush!
Thanks for reading along!
Until next week,
The thing with a falling market is, you have a lot of buyers who want to time the market and wait for the ‘bottom’ if you will. Essentially this means the level in which prices stop dropping further, as they have now reached their lowest point.
Well the latest statistics released for Metro Vancouver by the Real Estate Board show we are now at the infamous ‘bottom’.
July, which is usually one of the slowest months in Vancouver Real Estate, was the second busiest month this year and saw home buyer demand pick up. Across Metro Vancouver as a whole, there were 2,557 home sales in July 2019. This is a 23.5% increase from July 2018 and a 23.1% increase from June 2019. On top of this, the amount of homes listed across Metro Vancouver dropped by 4.9% since June 2019. Meaning buyer demand went up and inventory available went down.
To throw some more sexy numbers your way, check out the sales-to-active listing ratios below (this is basically a ratio determining how many homes have sold vs how many are available on the market):
Now what makes these numbers REALLY sexy is what they mean when it comes to market analysis. Generally when the ratio is below 12% for a sustained period of time, it puts pressure on prices to drop. However, when this percentage sits at 20% or more for a sustained period of time, it encourages pricing to rise! Note the Condos and Townhomes are sitting at 20% or above. With detached homes sitting at over 12% this suggests pricing at this level will remain at similar levels.
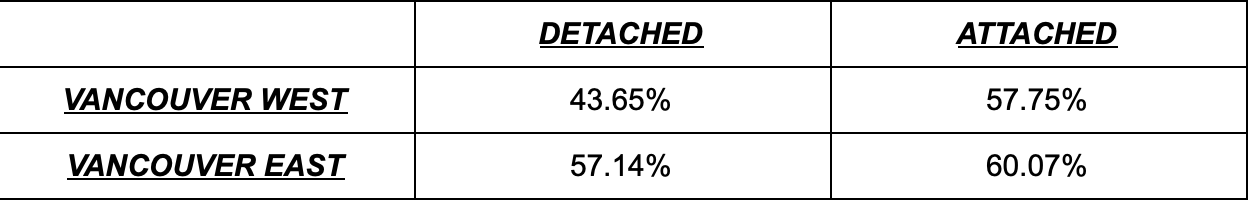
Now the above information is for Metro Vancouver. When we take a look at the smaller geographical area that is Vancouver Eastside and Westside (Including Downtown) we get the following ratios:
As you can see, some very high numbers there that show buyer demand is increasing. When getting more specific into an area, you can really see the macro picture of the neighborhood. Anyone looking for a house in Vancouver recently will be able to tell you first hand how much the demand has increased. We’ve seen multiple offer scenarios and various sales in a matter of days in the last month and the above percentages show why!
Of course, in order to make a difference in pricing, these figures need to remain higher for a sustained period of time, so don’t expect immediate price hikes. If the market continues in this direction though, this will inevitably have a knock on effect with regards to pricing. There is always some lee-way that needs to be given with these numbers as they can be skewed slightly, which is why the ‘sustained period of time’ is so important.
As this is really only the start of these market signs, this is enough to suggest we are at the bottom and anyone looking to hold out until this time, NOW IS YOUR TIME. Or you run the risk of missing the opportunity. A lot of people will still say we are at record lows, and however true that maybe, the market will always turn at some point and this looks to be it.
Interesting times to come in the Vancouver Real Estate market, especially as we have heard a lot of doom and gloom talk about a possible recession, various expectations and what not. Next month will be very interesting to see if the trajectory continues upwards on what would typically be one of the slower months in the market, before we start hitting the Fall (typical) rush!
Thanks for reading along!
Until next week,
Jay Mcinnes
T: 604.771.4606
jay@mcinnesmarketing.com
Ben Robinson
T: 604.353.8523
ben@mcinnesmarketing.com