May 2020 Vancouver Real Estate Update:
As of writing this, we sit in May of 2020, experiencing some substantial swings in numbers that frankly, Vancouver Real Estate has not seen before. On a more personal note, this year has seen worldwide pandemics, black lives matter protests across the world, killer hornets and a soon to be US Presidential election ….. It’s been a year already to say the least.
This time, we’re having to take a look at the figures from a more wider perspective for our market update. It’s not to say we were not doing this before, it’s just the numbers seemed to be saying the same story (ish). This year we have significant drops AND raises, so it’s a mixed story. On one side you have record lows, depending on which statistic you look at, you have a 50% drop from 2019, yet another statistic is a 50% increase.
For this reason, this month's market update is broken up into two parts:
Let’s get sexy and look at some figures:
First and foremost these numbers are not sexy. Sorry for leading you all on. The above shows a substantial drop across the board for New listings and sales vs 2019. We talk heavily to year-on-year statistics and we stand by that. We own when it’s good and when it’s bad. April was not a positive month for the numbers either.
So looking at the Home Price Index (HPI), this is basically a benchmark figure for residential homes. This number is currently sitting at $1,028,400. This is practically the same as in April 2020. In fact it’s actually a 1.4% increase over the past 3 months and a 2.9% increase since May 2019.
So the question on a lot of people’s mind is why? We went through a pandemic, it’s still ongoing, the numbers are significantly lower? In fact we’re 54.4% below the 10 year May Sales average and almost equally as down from the same 2019 sales figures. Not forgetting 2019 was a bad year (until July) in Vancouver real estate too?!
Well the answer to that is the sales to active listings ratio. It’s this figure that determines the type of market we are in. It works on a scale that looks like the following:
For May 2020 this figure combined, sat at 15%. So looking at the above scale, this was right in the middle of the balanced market. In April 2020 this number was 11.8%. In March 2020 this number was 26.3%.
You can see the huge range here. We’ve literally hit all 3 different markets in the last 3 months. So that SHOULD mean in March, prices were up, April they were down and May they are balanced. So how are we still 1.4% up in the last 3 months? Well it’s because real estate doesn’t react immediately, it’s slow. In order for real change to take effect we need to sit in the above ranges for 3+ months give or take. We often fluctuate between these markets so until we are in one for a substantial period of time, we do not see the effects i.e. prices rising or falling.
A lot of people don’t realise we were still below the 10 year sales averages in February 2020 (-15.6%) and March 2020 (-19.9%) respectively. However you try telling a buyer that at this time, and they’d laugh at you. Multiple offers, over ask and the like were commonplace before Covid-19. So in March, we were 20% below the 10-Year sales average, but still had a sales-to-active-listing ratio of 26.3%! Comfortably in a sellers market.
Let’s look at an example. Imagine May has an average number of sales equalling 5,000 over 10 years. Now let’s say one year we sell 2,500 homes in May. That’s 50% below the 10 year average. Sounds bad right?
Well what if I also told you that there were only 2,505 listings in May. That’s right, although we are below the 10 year sales average, practically every listing was bought. All of a sudden you’re seeing an extremely different picture as a sellers market. However we would still be below the 10-year average amount by 50%.
Now as mentioned above, let’s take a look at the trend we are seeing in the numbers month-over-month:
Immediately we can see April 2019 vs April 2020 was wildly different. Of course we were in full Covid-19 mode at this time, so although different, not surprising to anyone I don’t think.
May 2019 vs May 2020 is telling, in our opinion. Look at that difference in Listings this May (+59.3%) and Home Buyer Demand (+33.9%), especially when you look at those numbers vs April 2020. This shows the comfort level people are starting to reach with home buying/selling following the (hopeful) end of Covid-19. Even with the large jump in new listings, we are still down significantly in inventory vs May 2019. Yet home buyer demand is increasing.
It’s this reason we split this month's update into two parts. What’s happened thus far from a high level perspective can be misleading. It can provide a false sense of security in making decisions. However the trend on the ground is showing a different story. Summer in this market will be a very interesting story as we start to see the result of the phased openings and what that does to home buyer demand.
Thanks again for joining us for our May 2020 Vancouver Market Update.
Until next week,
As of writing this, we sit in May of 2020, experiencing some substantial swings in numbers that frankly, Vancouver Real Estate has not seen before. On a more personal note, this year has seen worldwide pandemics, black lives matter protests across the world, killer hornets and a soon to be US Presidential election ….. It’s been a year already to say the least.
This time, we’re having to take a look at the figures from a more wider perspective for our market update. It’s not to say we were not doing this before, it’s just the numbers seemed to be saying the same story (ish). This year we have significant drops AND raises, so it’s a mixed story. On one side you have record lows, depending on which statistic you look at, you have a 50% drop from 2019, yet another statistic is a 50% increase.
For this reason, this month's market update is broken up into two parts:
- What is actually happening right now with figures
- What the underlying trends are showing us is happening behind the scenes
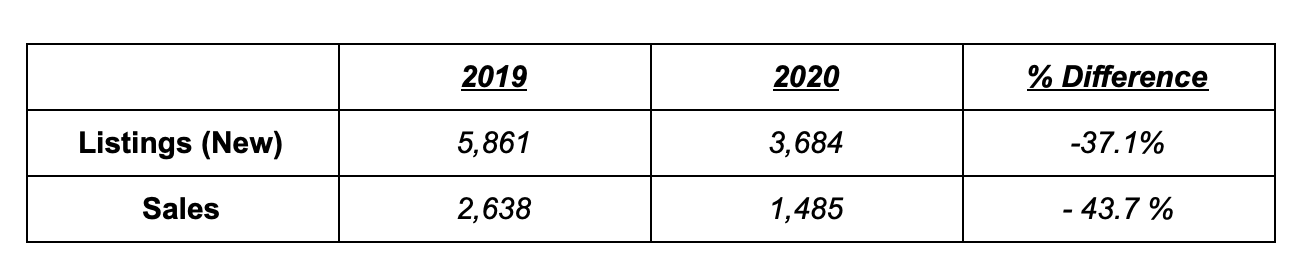
Let’s get sexy and look at some figures:
First and foremost these numbers are not sexy. Sorry for leading you all on. The above shows a substantial drop across the board for New listings and sales vs 2019. We talk heavily to year-on-year statistics and we stand by that. We own when it’s good and when it’s bad. April was not a positive month for the numbers either.
So looking at the Home Price Index (HPI), this is basically a benchmark figure for residential homes. This number is currently sitting at $1,028,400. This is practically the same as in April 2020. In fact it’s actually a 1.4% increase over the past 3 months and a 2.9% increase since May 2019.
So the question on a lot of people’s mind is why? We went through a pandemic, it’s still ongoing, the numbers are significantly lower? In fact we’re 54.4% below the 10 year May Sales average and almost equally as down from the same 2019 sales figures. Not forgetting 2019 was a bad year (until July) in Vancouver real estate too?!
Well the answer to that is the sales to active listings ratio. It’s this figure that determines the type of market we are in. It works on a scale that looks like the following:
- 1-12% - Buyers Market
- 12-20% - Balanced Market
- 20%+ - Sellers Market
For May 2020 this figure combined, sat at 15%. So looking at the above scale, this was right in the middle of the balanced market. In April 2020 this number was 11.8%. In March 2020 this number was 26.3%.
You can see the huge range here. We’ve literally hit all 3 different markets in the last 3 months. So that SHOULD mean in March, prices were up, April they were down and May they are balanced. So how are we still 1.4% up in the last 3 months? Well it’s because real estate doesn’t react immediately, it’s slow. In order for real change to take effect we need to sit in the above ranges for 3+ months give or take. We often fluctuate between these markets so until we are in one for a substantial period of time, we do not see the effects i.e. prices rising or falling.
A lot of people don’t realise we were still below the 10 year sales averages in February 2020 (-15.6%) and March 2020 (-19.9%) respectively. However you try telling a buyer that at this time, and they’d laugh at you. Multiple offers, over ask and the like were commonplace before Covid-19. So in March, we were 20% below the 10-Year sales average, but still had a sales-to-active-listing ratio of 26.3%! Comfortably in a sellers market.
Let’s look at an example. Imagine May has an average number of sales equalling 5,000 over 10 years. Now let’s say one year we sell 2,500 homes in May. That’s 50% below the 10 year average. Sounds bad right?
Well what if I also told you that there were only 2,505 listings in May. That’s right, although we are below the 10 year sales average, practically every listing was bought. All of a sudden you’re seeing an extremely different picture as a sellers market. However we would still be below the 10-year average amount by 50%.
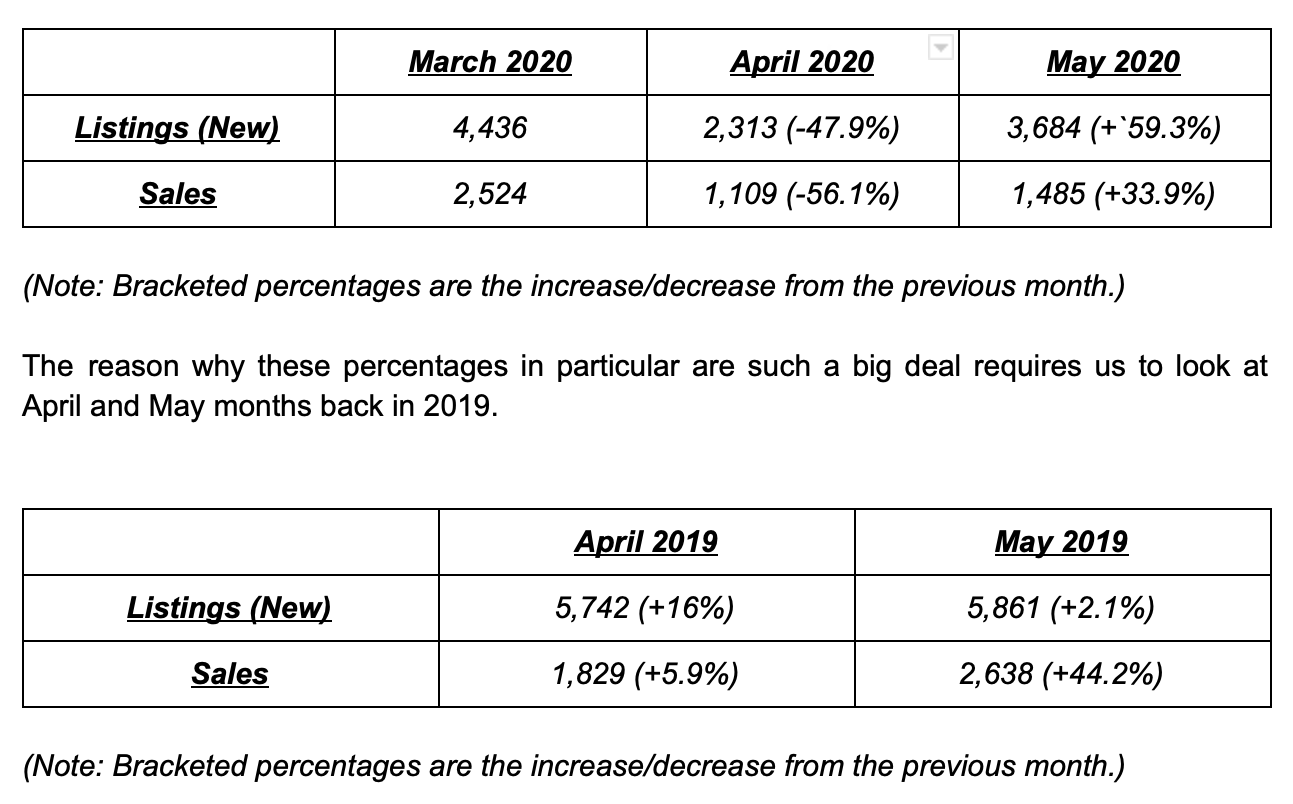
Now as mentioned above, let’s take a look at the trend we are seeing in the numbers month-over-month:
Immediately we can see April 2019 vs April 2020 was wildly different. Of course we were in full Covid-19 mode at this time, so although different, not surprising to anyone I don’t think.
May 2019 vs May 2020 is telling, in our opinion. Look at that difference in Listings this May (+59.3%) and Home Buyer Demand (+33.9%), especially when you look at those numbers vs April 2020. This shows the comfort level people are starting to reach with home buying/selling following the (hopeful) end of Covid-19. Even with the large jump in new listings, we are still down significantly in inventory vs May 2019. Yet home buyer demand is increasing.
It’s this reason we split this month's update into two parts. What’s happened thus far from a high level perspective can be misleading. It can provide a false sense of security in making decisions. However the trend on the ground is showing a different story. Summer in this market will be a very interesting story as we start to see the result of the phased openings and what that does to home buyer demand.
Thanks again for joining us for our May 2020 Vancouver Market Update.
Until next week,
Jay Mcinnes
T: 604.771.4606
jay@mcinnesmarketing.com
Ben Robinson
T: 604.353.8523
ben@mcinnesmarketing.com